A classification task that identified groups of people based on patterns of thinking and highlighted possible cognitive targets for precision mental healthcare.
Skills used:
- Bayesian Inference
- Python & R
- Machine learning
- Quantitative & Qualitative Statistics
Clustering is used as a classification method to create groups with similar features. With this project, I used hierarchical clustering to create groups of individuals that shared similar ‘patterns’ of thinking. That is, the characteristics of their everyday thinking were similar in regard to qualities like positivity, intentionality, timeframe, and episodic specificity. The intention was to see how particular patterns of everyday thinking were related to traits like psychological well-being (PWB). With this knowledge, it becomes possible to target patterns of thinking that are related to lower levels of PWB and attempt to foster those patterns that are more conducive to health.
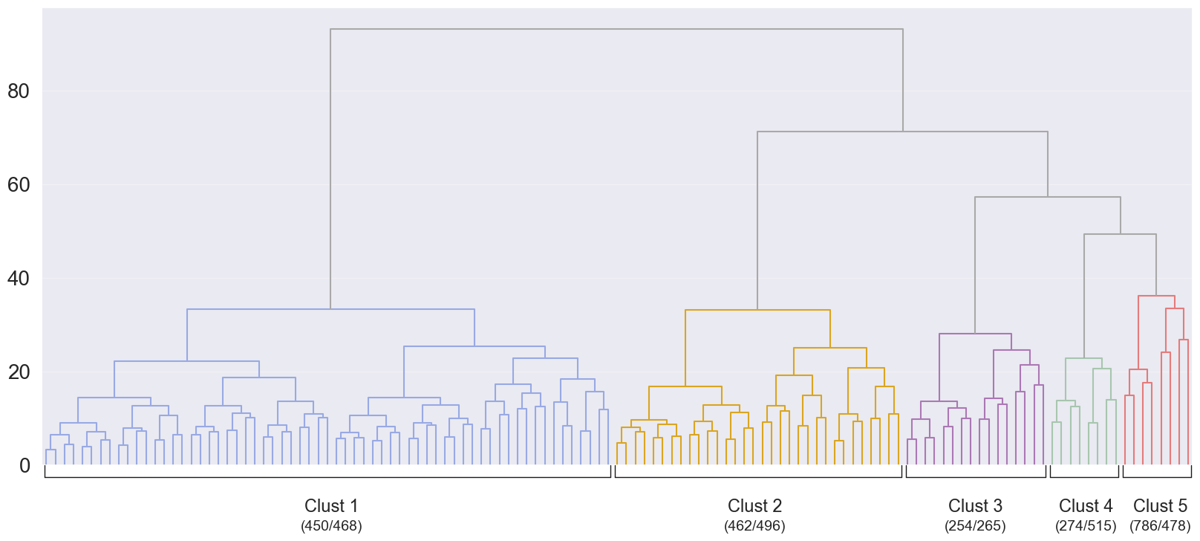
This project included data from over 2,200 individuals ranging from 18 to 86 years of age. As is illustrated in the figure at the right, the clustering solution could be split at any level of the hierarchy, from 2 large groups all the way down to that of the individual – over 2,200 groups. At those extremes, neither is very useful as the former doesn’t create enough meaningful differences to evaluate and the latter creates too many. Five groups (at a distance of about 40, as seen on the y-axis) seemed like a manageable number for analysis while also providing some variability so that groups could be compared.
One measure of how well the cluster groupings separate is a silhouette score. This score ranges from -1 to 1 indicating, respectively, completely inappropriate clustering to very distant and completely distinct groups. Our solution had a score of 0.07 which indicated that some participants may belong to more than one cluster. To evaluate this, two analyses were done. The first was to repeat the clustering 1,000 times and look for how often participants were classified into a different group. This process indicated that approximately 75% of the individuals were classified into their ‘correct’ cluster in the initial run.
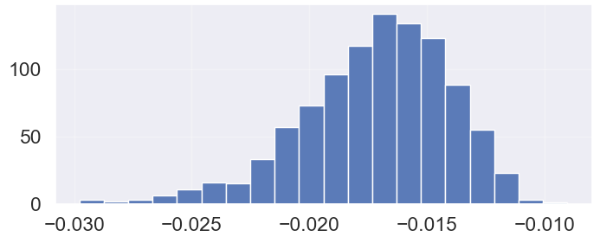
The second evaluation was to randomly assign participants to one of the five clusters and generate a silhouette score for that solution. The silhouette metric for 1,000 iterations of random assignment gave me a distribution of the clustering metric. This distribution can be seen to the left and shows that the silhouette metric centered at –0.017 and could range from between -0.03 and 0.01 when the clustering was completely random. Comparing the mean of this distribution to the silhouette score for our solution indicated that our solution was over 29 standard deviations from the mean of a random solution – meaning that our solution had essentially a 0% chance of being random in nature.
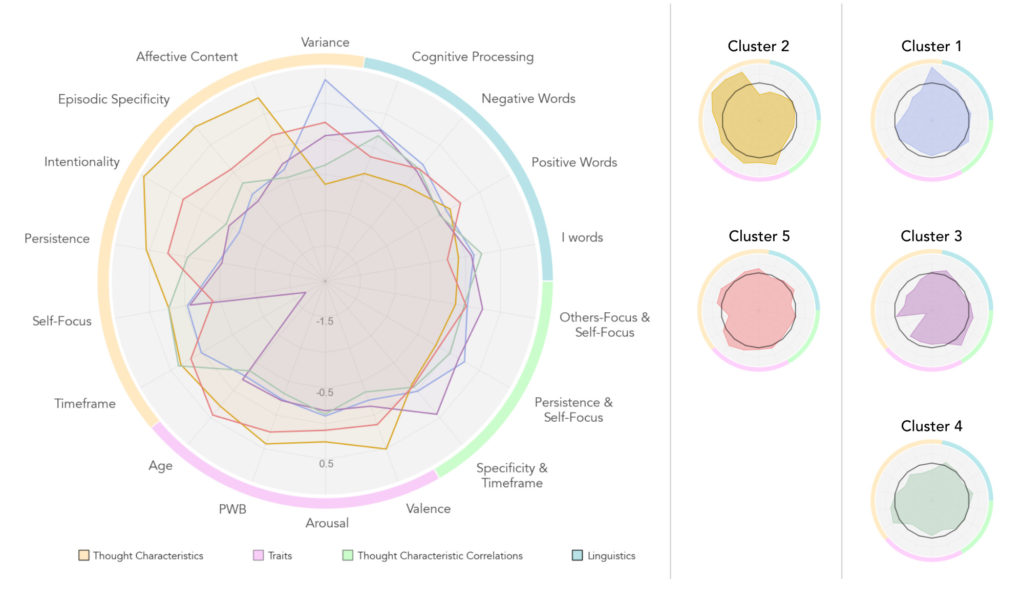
With a clustering solution identified, groups could now described and compared. As we can see below, looking at the means and variances of the different thought characteristics, differing patterns of thought could be seen across groups. The clusters identified might be colloquially interpreted as individuals who were predominantly:
- Inconsistent negative thinkers – more negative, spontaneous, and undirected thinking with a relatively-high variability across all measures.
- stable positive thinkers – higher ratings of positive, intentional, and persistent thoughts that are generally consistent.
- ruminative thinkers – more negative and persistent thought that is rooted in past-oriented thinking.
- stable melancholic thinkers – more negative and spontaneous thinking that varies little over time.
- vulnerable (or flexible?), thinkers – relatively more positive and directed thinking but with a range of inconsistency over most measures.
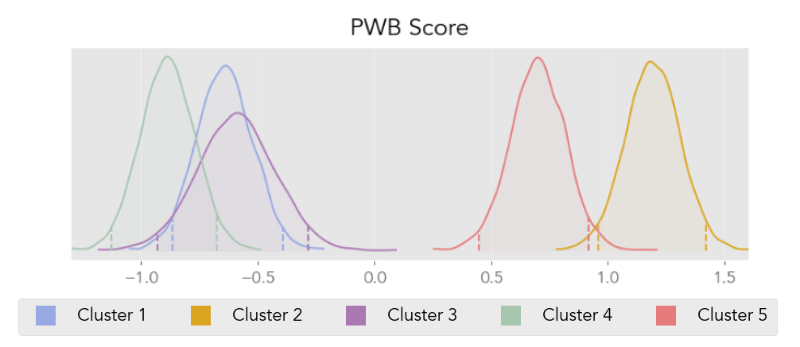
I also compared these groups over a number of more stable traits to see if they statistically differed. As mentioned previously, one trait of interest was PWB. Using a Bayesian ANOVA, I was able to compare participant clusters to see how they compared on this quality. Clusters 1, 3, and 4 (those that generally had more negative thought) were probabilistically the same in regard to their measure of psychological well-being. The remaining, more positive thinking groups, both had relatively higher PWB but did also have a greater than 95% probability that their PWB means differed from one another. These comparisons can be seen in the plot below where shapes display the distribution of possible means for each cluster’s psychological well-being score (dashed lines at either end of each distribution indicate the cut-offs for a 0.95 probability).
This analysis provided evidence that patterns of thought in everyday life can identify groups that have notable differences. Some of the clusters identified were seen as having lower scores of PWB while others showed the opposite result. Another finding was that these groups differed in their thought patterns, indicating that both higher and lower psychological well-being may come about via different routes. For example, lower PWB may be related to highly variable thinking or potentially to thinking that is consistently focused on the past. With more healthy patterns, stable, positive, and intentional thinking seems to have the most positive relationship with PWB while goal-directed thinking that is also less self-focused may also foster higher overall health, even if there is moderate variability. These findings have implications for precision mental healthcare as treating an individual may not only require a clear understanding of their symptoms of dysfunction, but also of their cognitions in everyday life. If healthcare providers had this level of information, they would understand that if an individual from cluster 1, for example, and from cluster 3 both came in for the treatment of anxiety, that those individuals would have differing needs on their quest toward greater psychological health.
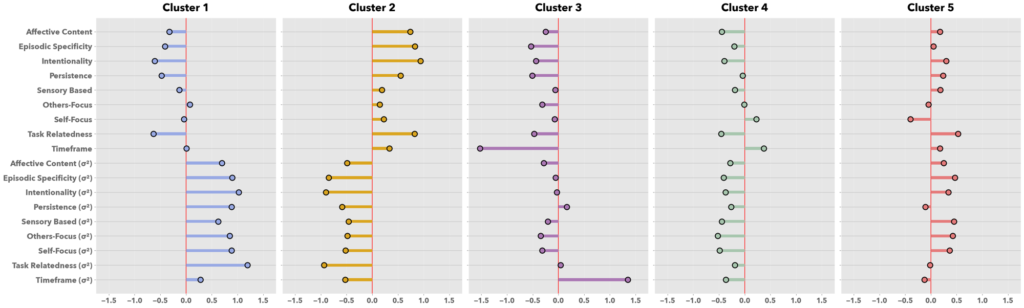
Other trait-level comparisons were performed as a part of this analysis. The plots below show how the groups differed from each other on selected measures.