
A multinomial logistic regression analysis to determine word use across groups with the intention of identifying hallmarks of experience and a better understanding of the strengths and concerns of individuals.
Skills used:
- Machine Learning
- Python
- Quantitative & Qualitative Statistics
In the Clustering and Bayesian Comparison project, I demonstrated how thought patterns in everyday life could be used to differentiate groups of people. Importantly, these groups differed on traits that could be helpful to precision mental healthcare. To further understand how these groups differed, I wanted to explore word use within and across the identified groups. Words and language are ubiquitous in our everyday life and the words that we choose to use, along with those that we choose not to, can provide vital clues about the things that preoccupy our thoughts.
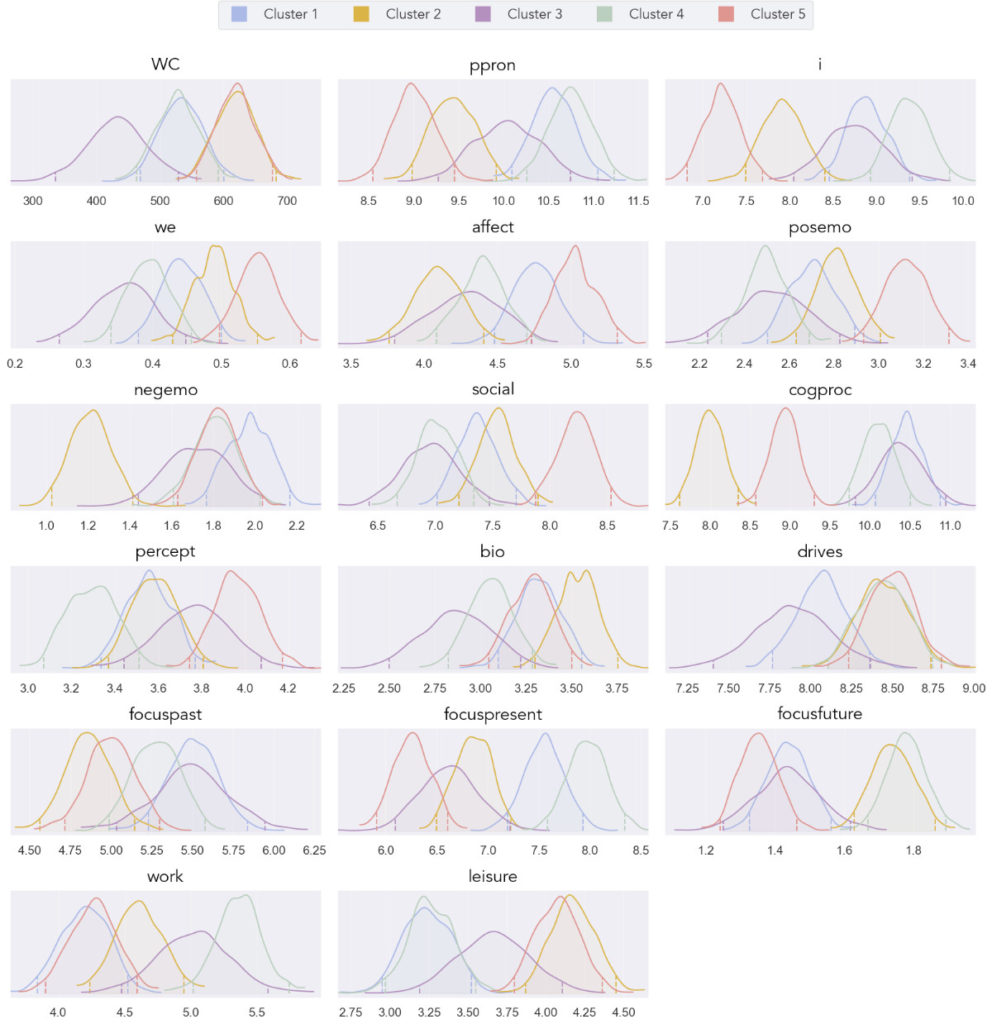
Data collected from Mind Window not only contains measures about the characteristics of thoughts that people have in their everyday lives, but also provides a ‘free-response’ option for users to enter information about what they were doing, feeling, or thinking. In this analysis, I used data from over 1,500 individuals who provided at least 100 words along with their thought characteristic data (the average number of words being 562 – practically a small essay about their experiences). Looking at these words, frequency analysis was used to provide some basic information about the language that was used between groups. These frequencies were then compared via Bayesian ANOVA to see which word groupings differed with at least a 95% probability.
The groups differed in almost all of the linguistic categories that were compared. This included not only word count, but also categories like: positive emotion, negative emotion, social, cognitive processing, work, leisure, and ‘I’ words. The figure to the right shows each group’s posterior distributions from the Bayesian inferential approach. In these plots, if dashed lines for a distribution are outside of the dashed lines of another, there is a 95% probability that the groups differ on that measure.
While word frequency analysis is a quick and easy way of characterizing language use, it is rather broad in its application and the word categories can seem somewhat arbitrary. As such, another approach was pursued where logistic regression was used to determine which specific words had lesser or greater odds of predicting a participant’s group membership. This analysis was performed on over 2,000 participants with 2,000 words being, potentially, predictive features. The results indicated that some words were almost six times more likely to predict a particular group while others were nearly nine times likely to favor other groups when compared to use within one’s group. The top-five ‘favoring’ and ‘not-favoring’ words and their respective odds ratios can be seen in the tables below. Additionally, word clouds with the top 10 predictive words are also shown below where words colored in red favor that group while words in blue favor other groups (when compared to the one being considered). Words in the clouds are sized based on the strength of their predictive/non-predictive quality.
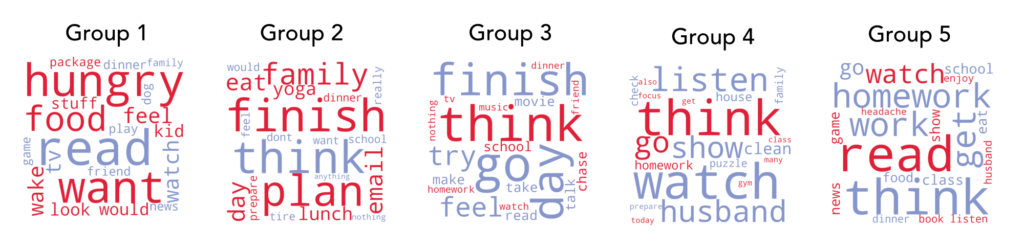
The group, from the Clustering and Bayesian Comparison project, with the highest psychological well-being (PWB) was group two. As can be seen in the figures, this group was most associated with words that seemed to indicate completion and task-related action. Other predictive words for cluster two included “plan” and “prepare” while the least associated words included “think” and “want.” Cluster five seemed to be most favored by words that involved leisure – the words “read” and “watch” being the ones that most favored this cluster while lower associated words were “think” and “get.” Group one, the group with the lowest PWB score, seemed most predicted by drive-related words like “hungry” and “want” while least associated with leisure-related words (“read,” “watch,” “tv”).
While these analyses don’t tell us that the language use of everyone in a particular group is dominated by these words, it does help to determine the trend of the content in a group’s naturalistic and everyday thought. Additionally, it provides a connection between specific words and the traits that are characteristic of certain groups (e.g., anxiety, goal orientation, age, and PWB). Having an understanding of these indicative words allows us to better understand the inner world of these individuals and sets up an additional mechanism for providing more effective mental health care.
| Word 1 | Word 2 | Word 3 | Word 4 | Word 5 | |
|---|---|---|---|---|---|
| Group 1 | hungry | want | food | feel | wake |
| odds | 2.00 | 1.82 | 1.63 | 1.58 | 1.51 |
| Group 2 | finish | plan | family | eat | day |
| odds | 2.45 | 2.37 | 1.92 | 1.91 | 1.90 |
| Group 3 | think | school | chase | homework | nothing |
| odds | 5.73 | 3.17 | 2.17 | 2.00 | 1.95 |
| Group 4 | think | go | homework | class | many |
| odds | 5.44 | 3.61 | 2.84 | 1.97 | 1.95 |
| Group 5 | read | watch | news | show | game |
| odds | 3.53 | 2.49 | 1.86 | 1.74 | 1.72 |
| Word 1 | Word 2 | Word 3 | Word 4 | Word 5 | |
|---|---|---|---|---|---|
| Group 1 | read | watch | tv | game | news |
| odds | 0.31 | 0.47 | 0.48 | 0.52 | 0.55 |
| Group 2 | think | want | tire | really | school |
| odds | 0.27 | 0.59 | 0.63 | 0.64 | 0.65 |
| Group 3 | go | finish | day | try | feel |
| odds | 0.51 | 0.70 | 0.70 | 0.71 | 0.73 |
| Group 4 | watch | listen | husband | show | clean |
| odds | 0.47 | 0.57 | 0.62 | 0.65 | 0.71 |
| Group 5 | think | homework | get | work | go |
| odds | 0.11 | 0.19 | 0.33 | 0.36 | 0.42 |